Interactive multimedia learning refers to online instructions that combine multimedia with activities to help learners apply their understanding and receive feedback (Biffi and Woodbury, 2019). There are various forms of multimedia such as images, videos, audio, and text, that can be used in education and make learning a fun experience.
Personally, infographics have been my favourite way to learn. As a student in the Health Informatics program, I have had numerous opportunities to create infographics for course assignments. As someone who also enjoys doing art, I found infographics as an opportunity to be creative and have fun while learning new material.
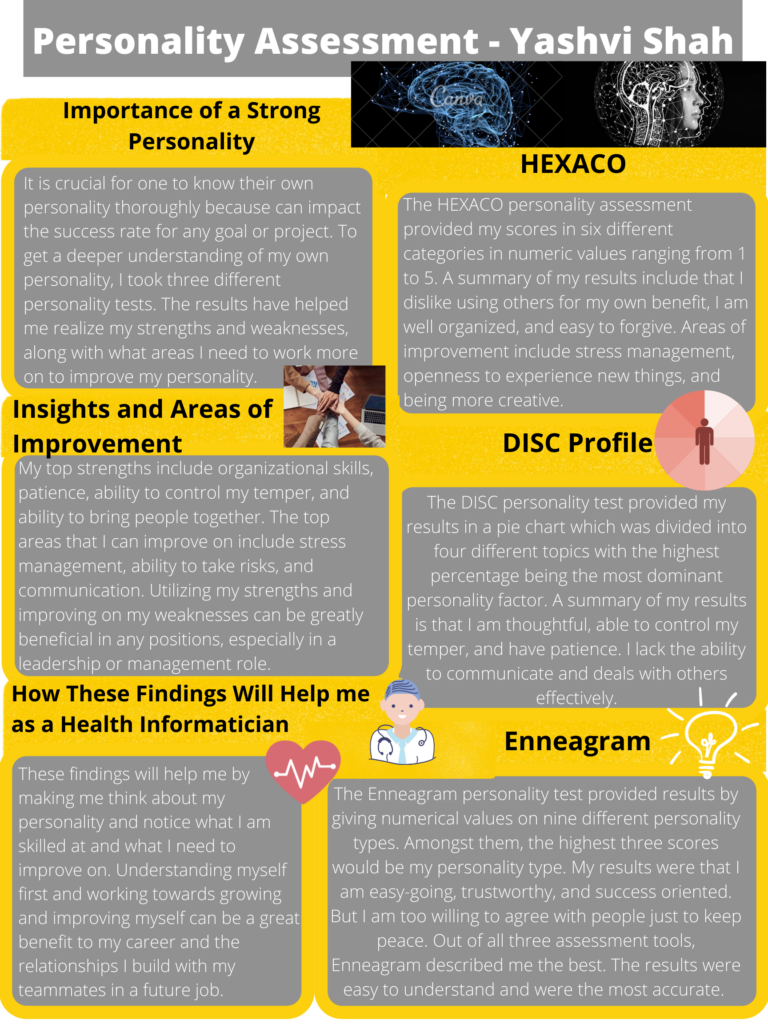
For Assignment 3 in EDCI 337, the multimedia object that I previously created is an infographic about personality assessments. I created this infographic on Canva for a Health Information Science course I did in the Fall semester of 2021, also shown in Figure 1 below. After learning about the various multimedia principles in EDCI 337, I can notice areas in the infographic that can be improved.
Multimedia Principles
The Cognitive Load Theory developed by Richard Mayer describes how learners process multimedia information and how the design of learning materials can be improved to achieve positive learning outcomes (Biffi and Woodbury, 2019). This includes extraneous load and intrinsic load. For this assignment, I would like to dive deeper into extraneous load which refers to wasted cognitive effort on details that do not support the learning outcomes. Extraneous load can be prevented by only focusing on the necessary information (Davis, 2020).
The Limited-Capacity Assumption states that people have a limit on the amount of information they can process at a given time (Davis, 2020).
Updated Multimedia Object
I took these multimedia principles into consideration when reviewing and re-designing my previous infographic. Figure 2 below shows an improved version of the infographic.
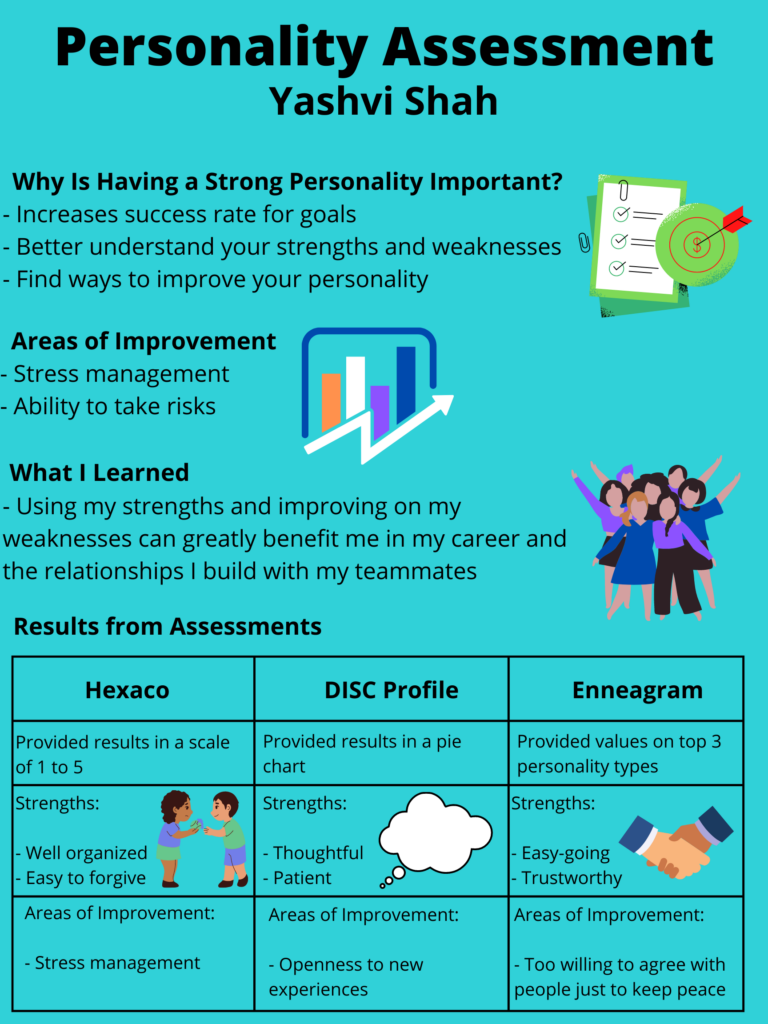
Firstly, I noticed that it was text heavy. Therefore, I minimized it by only keeping the essential information. I also realized that the information needs to be more spaced out. Since it was previously in paragraphs, I changed to bullet form to allow the information to be seen and understood more easily.
According to Mayer’s observation, people learn better when interactive multimedia, such as text and images combined, is used. I agree with Mayer’s observation and therefore ensured I used more colours, fonts, and images when re-designing the infographic to make it more visually appealing. I also incorporated a table to compare my personality assessment results side-by-side to make it easier and faster to process the information at the given moment.
References
Davis, G. (2020, January 31). Principles of Multimedia Learning. Center for Teaching and Learning | Wiley Education Services. https://ctl.wiley.com/principles-of-multimedia-learning/
Biffi, E., and Woodbury, M. (2019). Interactive Multimedia Learning vs. Traditional Learning in Optometry: a Randomized Trial, B-scan Example | The Journal of Optometric Education. Association of Schools and Colleges of Optometry (ASCO). https://journal.opted.org/article/interactive-multimedia-learning-vs-traditional-learning-in-optometry-a-randomized-trial-b-scan-example/#:%7E:text=Interactive%20multimedia%20learning%20is%20defined,receive
Leave a Reply
You must be logged in to post a comment.